Amazon Profit Analytics: The 7 KPIs That Actually Predict Whether Your Listing Is Profitable
The 7 KPIs That Actually Predict Whether Your Listing Is Profitable
Why “revenue is up” doesn’t mean a thing — and the numbers that do
Open any Seller Central dashboard and you’ll see the same headline metric front and center: total sales. It feels good. It’s also one of the least useful numbers in your entire business.
A listing can post record revenue and still lose money every time it sells — a $0.50 fee increase here, a creeping ACOS there, a return rate nobody’s watching. The sellers who consistently grow aren’t the ones with the highest sales. They’re the ones who treat Amazon profit analytics as a daily habit instead of a once-a-quarter spreadsheet exercise.
This guide breaks down the seven KPIs that actually tell you whether a listing is making money, why most sellers track them wrong, and how to set up a system that surfaces problems before they eat your margin. To monitor these metrics without drowning in spreadsheets, a dedicated analytics platform like Nova Data, one of the best Amazon seller analytics tools, makes it easy to spot margin leaks early and act on them fast.
Why Revenue Lies to Amazon Sellers
Revenue tells you how much money changed hands. It says nothing about what’s left after Amazon’s referral fee, FBA fulfillment and storage fees, PPC spend, COGS, returns, and the dozen smaller line items that quietly stack up on every order.
Two SKUs can post identical monthly sales and land on opposite ends of the profitability spectrum. Without visibility into the cost stack behind each sale, you’re managing a business with half the dashboard turned off.
The 7 KPIs That Actually Predict Profitability
- Net Margin % — net profit divided by net sales, after every fee, ad dollar, and refund. This is the number that should gate every reorder and every new-SKU launch decision.
- Contribution Margin (CM2 / CM3) per Unit — profit per unit after COGS and Amazon fees (CM2), then after advertising too (CM3). Aggregate net margin can hide a SKU that’s losing money on every single sale.
- TACoS — total advertising cost of sale, measured against total revenue rather than just ad-attributed revenue. It’s the clearest read on whether PPC is actually driving the business or just buying the sales you’d have gotten anyway. (Here’s a full breakdown of how TACoS works if you want to go deeper.)
- True FBA Fee Load — fulfillment, storage, inbound transportation, and removal fees combined, tracked as a percentage of revenue per SKU. Dimensional weight changes and storage tier shifts can erode margin for months before anyone notices.
- Return Rate Impact on Profit — not just the return rate itself, but what it actually costs once you factor in refunded fees, restocking, and unsellable inventory. High-return SKUs often look profitable until this line is added in.
- Ad Spend to Profit Ratio — ad spend measured against profit dollars generated, not just sales generated. A campaign can hit a great ROAS target and still be a net drag on the bottom line if margins are thin.
- Refund-Adjusted Profit — profit recalculated after refunds and reimbursement timing, since Amazon often processes these weeks after the original sale and most sellers never reconcile the gap.
Why Most Sellers Track This Wrong
Three things usually break a seller’s grip on profit data:
- Manual spreadsheets that require pulling reports from three or four separate places and reconciling them by hand — a process most sellers do monthly at best.
- Seller Central’s native reporting, which typically lags 24–48 hours and rarely breaks costs down to the SKU level.
- Fee categories that get missed entirely — storage tier changes, inbound placement fees, and small surcharges that don’t show up unless you’re reconciling against the actual settlement report.
By the time any of this surfaces in a monthly spreadsheet, a losing SKU may have been bleeding margin for weeks.
Building a System That Catches Problems Early
The fix isn’t working harder in a spreadsheet — it’s removing the manual reconciliation step entirely. Automated profit analytics platforms sync directly with Seller Central and Amazon Advertising, mapping every fee line to the SKU level automatically, so net margin and CM2/CM3 update continuously instead of once a month.
If you’re not ready to commit to a full platform yet, even running your numbers through a free Amazon profit calculator before launching a new SKU will catch a lot of the fee-and-margin surprises that sink new listings in their first 90 days.
Whichever route you take, the goal is the same: catch a margin problem in week one, not in the quarterly review.
Turning Profit Data Into Action
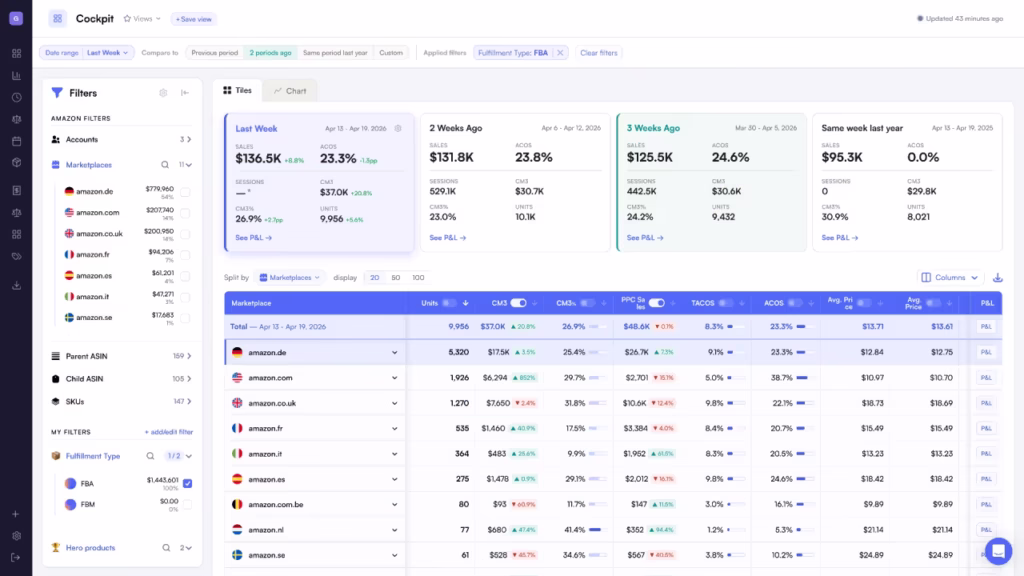
KPIs only matter if they change what you do next. In our own account management work, the profit-level view is what actually drives the PPC and listing decisions — not the other way around:
• A SKU with strong CM2 but weak CM3 usually means ad spend is too aggressive relative to margin — the fix is in the campaign structure, not the listing.
• A rising true FBA fee load on an otherwise healthy SKU often means it’s time to revisit packaging dimensions or reassess fulfillment strategy.
• A high return rate eating into refund-adjusted profit points back to the listing itself — images, sizing information, or set expectations — more often than it points to the product.
None of these decisions is visible from a sales dashboard. They only show up once profit is broken down to the SKU level and tracked continuously.
The Bottom Line
Sales tell you what happened. Profit analytics tell you what to do next. The sellers who scale sustainably on Amazon are the ones who’ve made the switch from checking revenue to checking margin — and who’ve built a system that surfaces the seven KPIs above without a spreadsheet marathon every month.
Need help putting these numbers to work? eCom Gliders manages PPC, listings, and account strategy for Amazon brands — get in touch for a free account audit.
-
eCom Gliders
- Reading time 6 min
Recent Posts
- All Post
- Amazon Compliance
- Amazon FBA Guide
- amazon market analysis
- Amazon PPC
- Amazon PPC & Advertising
- Amazon SEO
- Amazon Stock
- Amazon Tools
- Business Strategy
- eCommerce
- Ecommerce News & Analysis
- Full Account Management Services
- Guide
- Guide 2025
- News
- News 2026
- PPC Services
- Prime day
- Stories
- Team Memebers
- Technology and Digital Services
- Top Agencies
- Top PPC tools
- Why we are Unique?
Get a Quick Solution
Need help fast? Our expert team is here to provide you with efficient and reliable solutions tailored to your needs. Don’t wait—reach out today!
Categories
- Amazon Compliance (5)
- Amazon FBA Guide (7)
- amazon market analysis (5)
- Amazon PPC (40)
- Amazon PPC & Advertising (3)
- Amazon SEO (9)
- Amazon Stock (1)
- Amazon Tools (17)
- Business Strategy (12)
- eCommerce (2)
- Ecommerce News & Analysis (6)
- Full Account Management Services (105)
- Guide (1)
- Guide 2025 (20)
- News 2026 (16)
- PPC Services (58)
- Prime day (2)
- Technology and Digital Services (1)
- Top PPC tools (1)
- Uncategorized (1)
- Why we are Unique? (11)
Subscribe for Growth Tips, Seller Hacks & eCom Wins


